Attractor Seeder
This tool was originally meant to be a personal tool to make my art production process more efficient. When I thought I may not be the only one who could take advantage of it, I decided to make it public (and better).
You can check and use the tool , or check the repository and do with its contents whatever you want.
The problem
The attractors I work with are Clifford
and De Jong
attractors. With these attracors, you have a pair of equations that produce
totally different results depending on four variables a, b, c, and d.
The equations are:
- Clifford:
- $$x_{n+1} = sin(a \times y_n) + c \times cos(a \times x_n)$$
- $$y_{n+1} = sin(b \times c_n) + d \times cos(b \times y_n)$$
- De Jong:
- $$x_{n+1} = sin(a \times y_n) - cos(b \times x_n)$$
- $$y_{n+1} = sin(c \times x_n) - cos(d \times y_n)$$
So you need to produce several attractors with random values for the variables until you find one that you find attractive, and render it in higher quality.
Rendering attractors in high quality can be expensive. And if you don't already know that the produced attractor will look great, you'll be losing a lot of time.
This has two solutions:
- Modify your code so it renders in poor quality until you find one attractor you'd like to render in higher quality.
- Have two separate programs: one to mass-produce attractors in poor quality, and one to render just one piece in high quality.
Originally, I did the former. But constantly modifying the code made me slow, and the task unpleasant. So I decided to implement the latter.
The solution
I chose to make a web app because JavaScript is the language I've used the most, and P5.js the library I use to produce images anyways.
I originally thought of a tool to make a grid of attractors, each one displaying the values that generated them. I started producing one canvas divided in multiple squares, drawing one attracor per square. But this made it hard to deal with one attractor at a time.
Then I moved to producing multiple canvas in a single page, and drawing one attractor per canvas. Although it generated more problems at the beginning, it was certainly a more scalable solution.
This new approach allowed me to introduce new functions I didn't think about at first:
- Adding buttons to directly render that attractor in higher quality
- Preventing certain attractors from updating when re-running the tool.
- Copy the values in case you want to use them in your own renderer.
Attractor Seeder v1.0.0
This was built using plain HTML, JavaScript to produce the grid of canvases, P5.js to draw the individual attractors, and some CSS to style the main page.
./

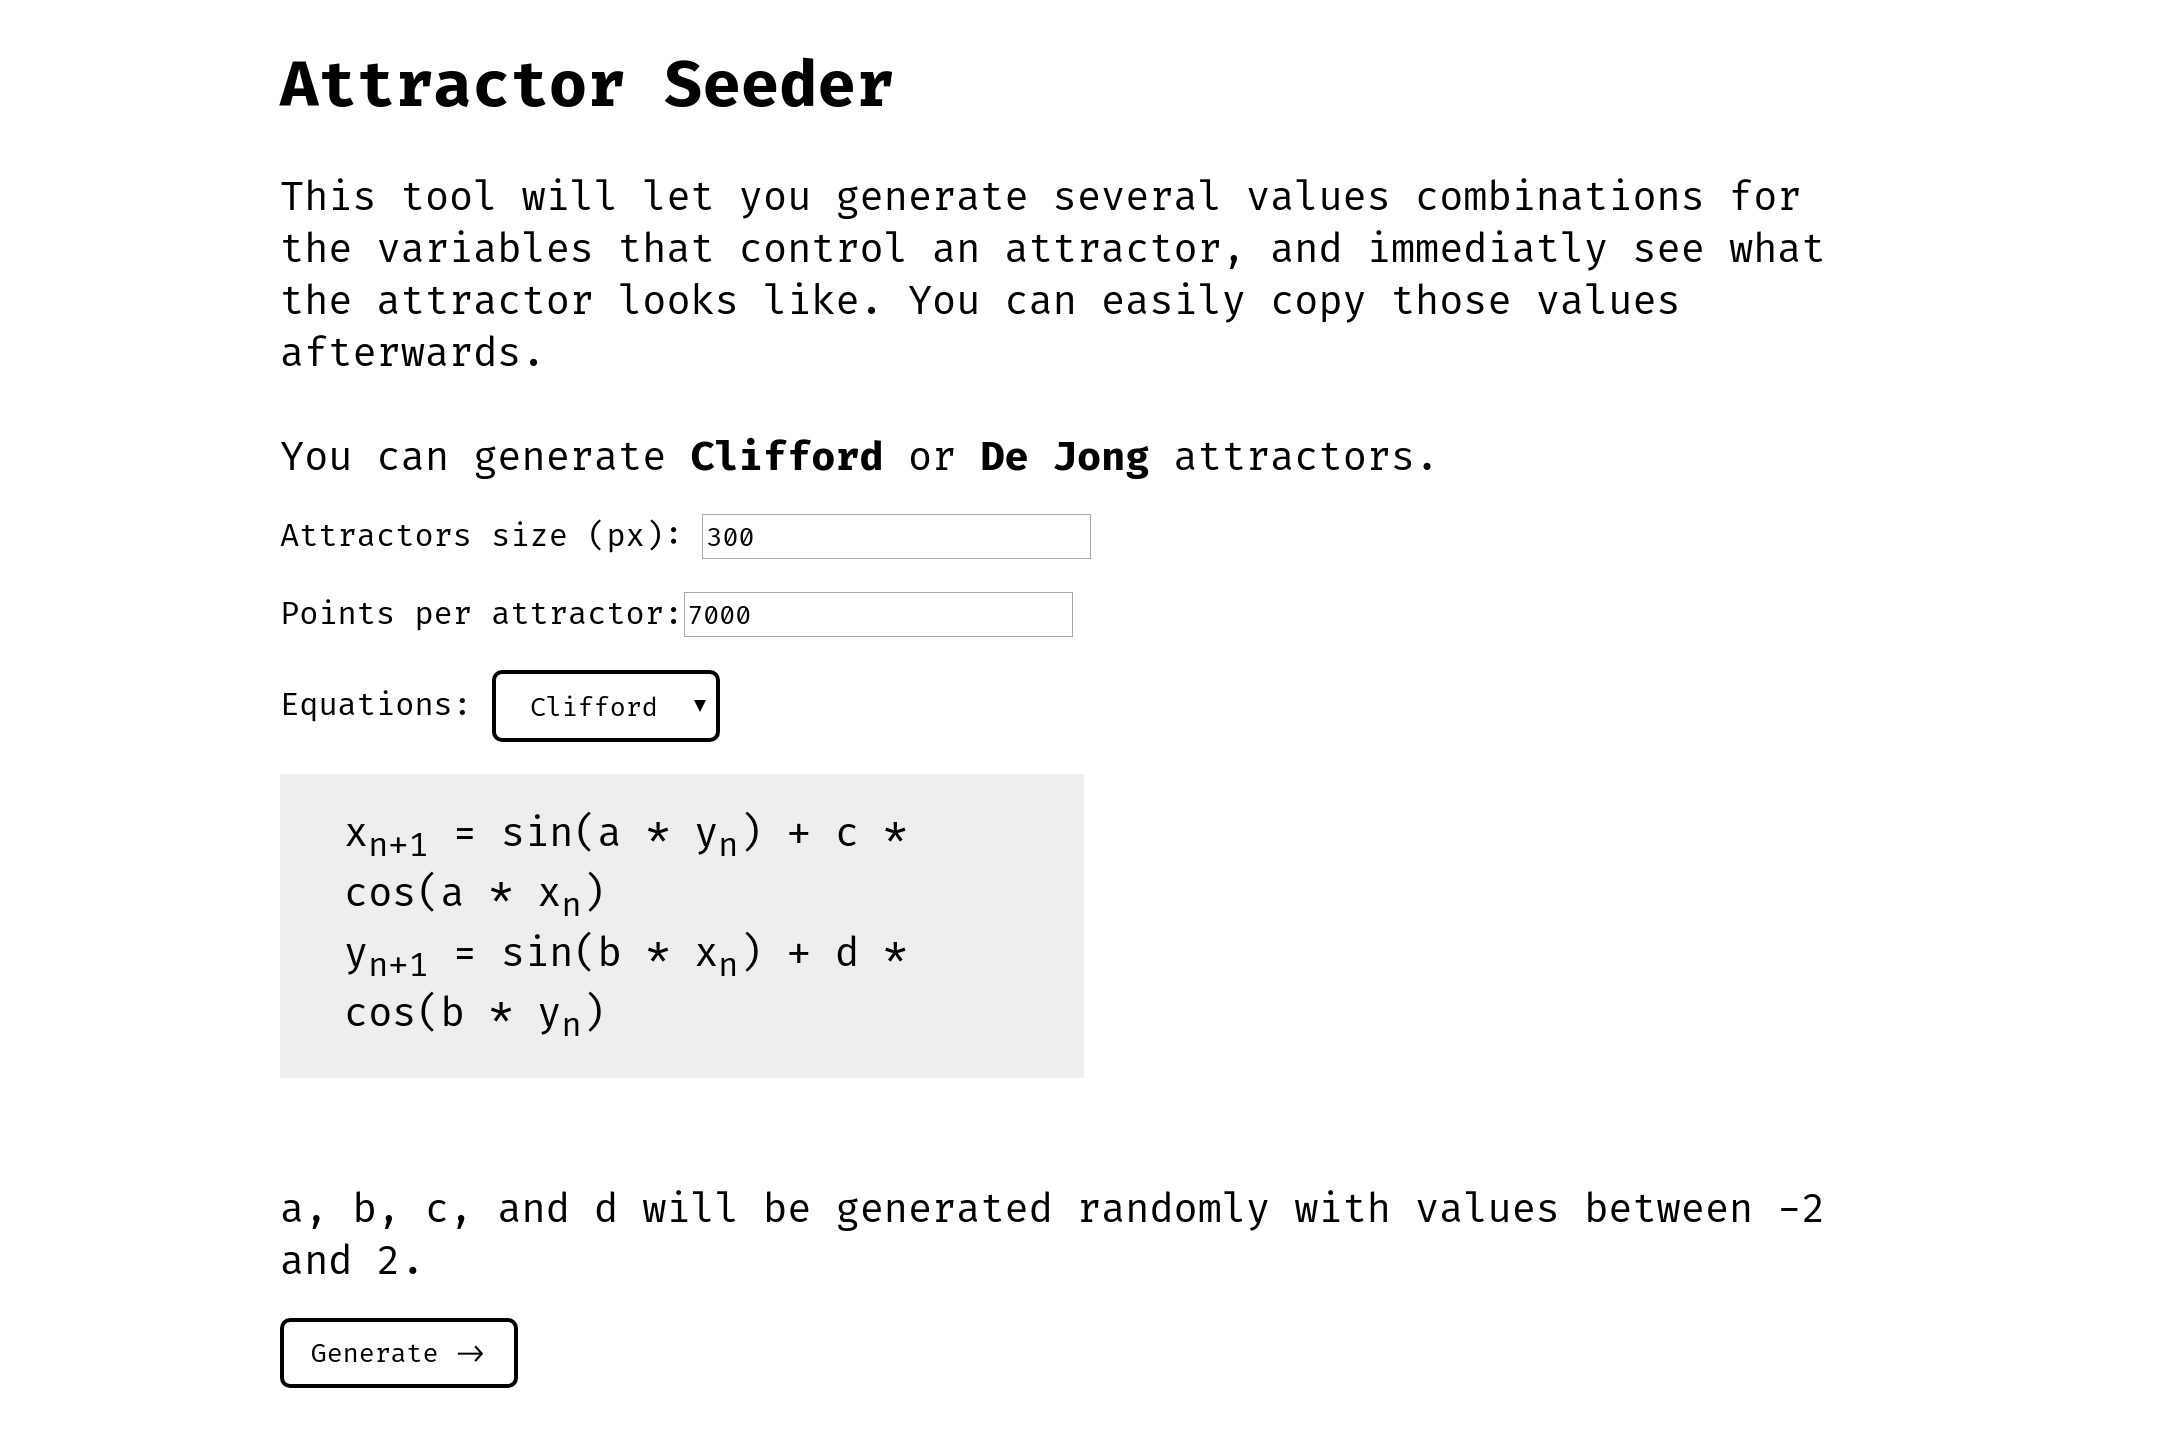
The index explains what the tool is about, and prompts you the variables that will be used to generate the grid:
- Size of the individual canvases. The program will fit as many squares with this dimension may fit into the screen.
- Number of points to draw. The higher, the more defined will be the structure of the attractor, but it will be more expensive to compute.
- The equations. Either Clifford or De Jong for now. I may add other alternatives later.
Pressing Generate redirects to ./grid sending the form values as URL
parameters.
./grid

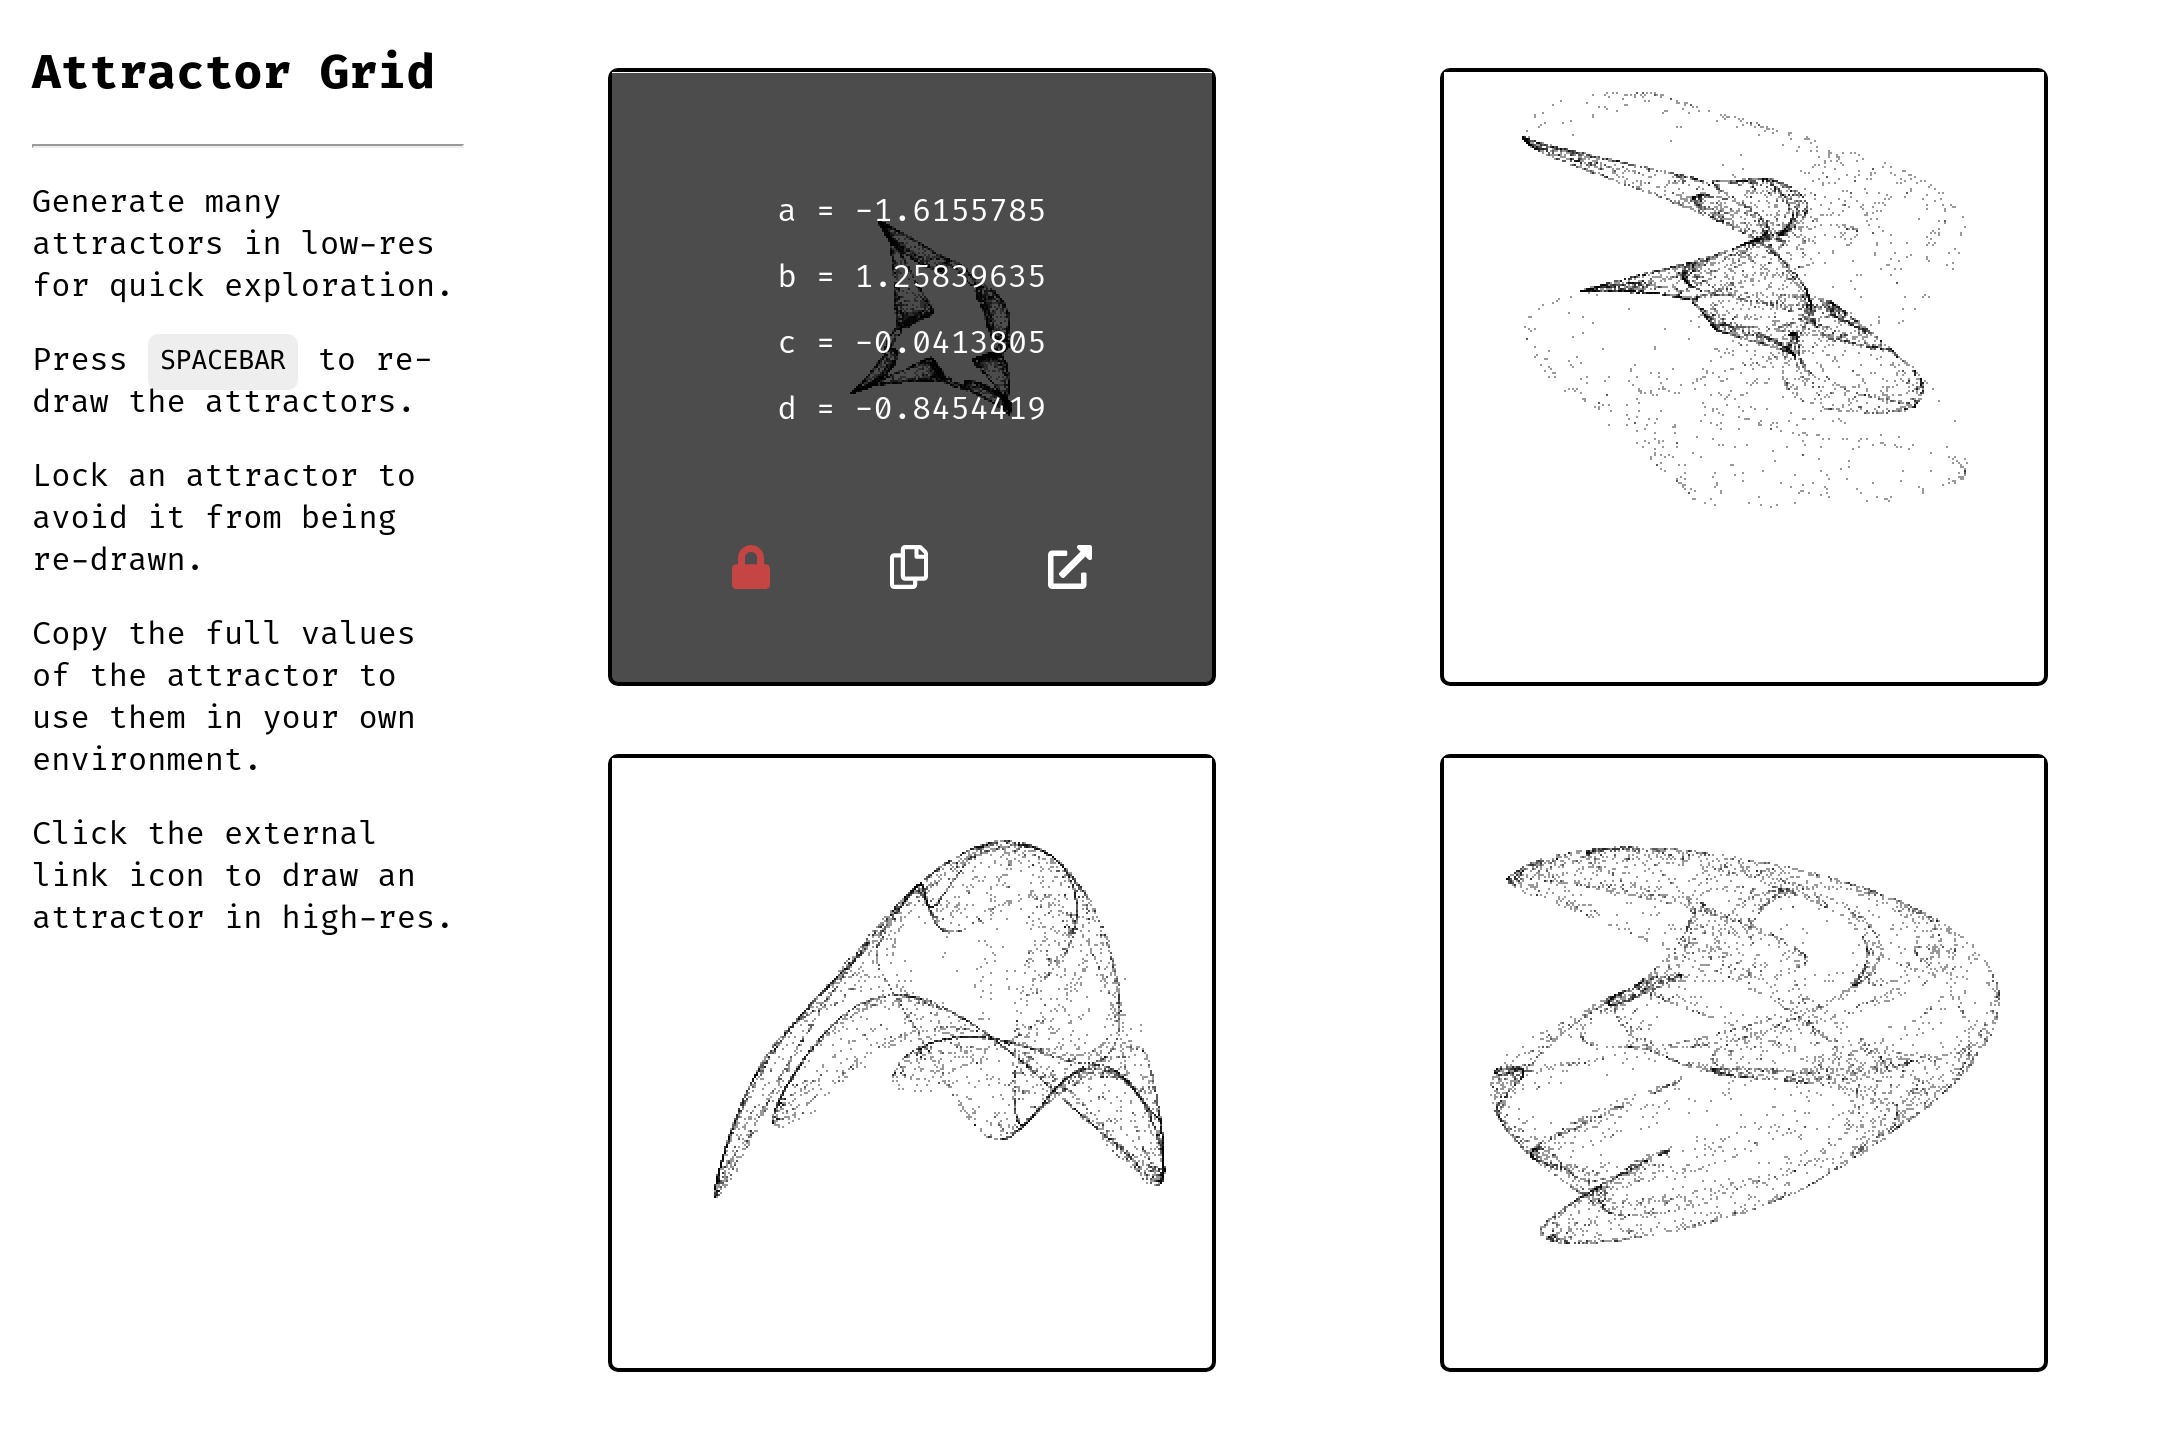
The ./grid/ page is where you mass-generate attractors.
The URL parameters it takes are: size, points, equations.
To generate a new grid, you don't need to reload the page. Just press Space and it will re-generate all the unlocked attractors.
Each attractor has 3 buttons:
- Lock/Unlock the attractor. This avoids the attractor from being regenerated when Space is pressed.
- Copy a, b, c, d. This copies the double-precision numbers for a, b, c, and d that produce the attractor.
- Render alone. To get a higher quality render of this attractor. This redirects
to
/drawer/sending the appropiate equations and values
./drawer
The ./drawer page is where you can draw a single attractor with specified
quality.
The URL parameters it takes are equations, a, b, c, d, points,
alpha.
- Equations. For now they're limited to
cliffordordejong. - a, b, c, d. Numbers that define the variable values.
- Points. The number of points to plot in the image.
- Alpha. The opacity of a single point.
The more points you include in your image, the smaller the alpha value should be.
For now, the only resolution available is 2048 x 2048.
Aims for future versions
Better drawing algorithm
Currently, the ./drawer page draws circle with small radius for every point
the attractor generates. This is incredibly inefficient, since the graphics
library has to compute how many pixels every circle will affect. Then in what
proportion, and then applying those changes.
A more efficient approach I've been thinking is this:
- Compute all the points the attractor produces.
- Produce a 2D histogram from the points.
- Normalize the histogram, so all values are within 0 and 1.
- Use the new values in the histogram to fit those values in a color map, writing color directly to the pixel array of the image.
This won't be just more efficient, but will avoid having to tune the alpha
value for different number of points. This will assure the most populated points
in the histogram will be fully-colored.
And of course, the advantage of having custom color maps like viridis and
magma.